Most retail investors rely almost exclusively on the price-to-earnings (P/E) ratio when evaluating stocks, and that’s a mistake—particularly when it comes to technology companies. The price-to-sales ratio (P/S) often reveals what P/E misses entirely, especially for the high-growth tech companies that dominate modern portfolios. If you’ve been evaluating Amazon, Snowflake, or Palantir using P/E alone, you’ve probably been looking at the wrong metric entirely.
The P/S ratio strips away the noise of accounting decisions and one-time charges that distort earnings, focusing instead on a simpler question: how much are investors paying for each dollar of revenue? For tech investors willing to look beyond quarterly earnings, this metric opens up an entirely different lens for valuation.
What Is the Price-to-Sales Ratio?
The price-to-sales ratio measures the relationship between a company’s market capitalization and its total revenue. It answers a deceptively simple question: if you bought the entire company, how many years would it take for the revenue to pay back your investment at the current pace? The lower the number, the cheaper the stock appears relative to sales.
Here’s the core formula:
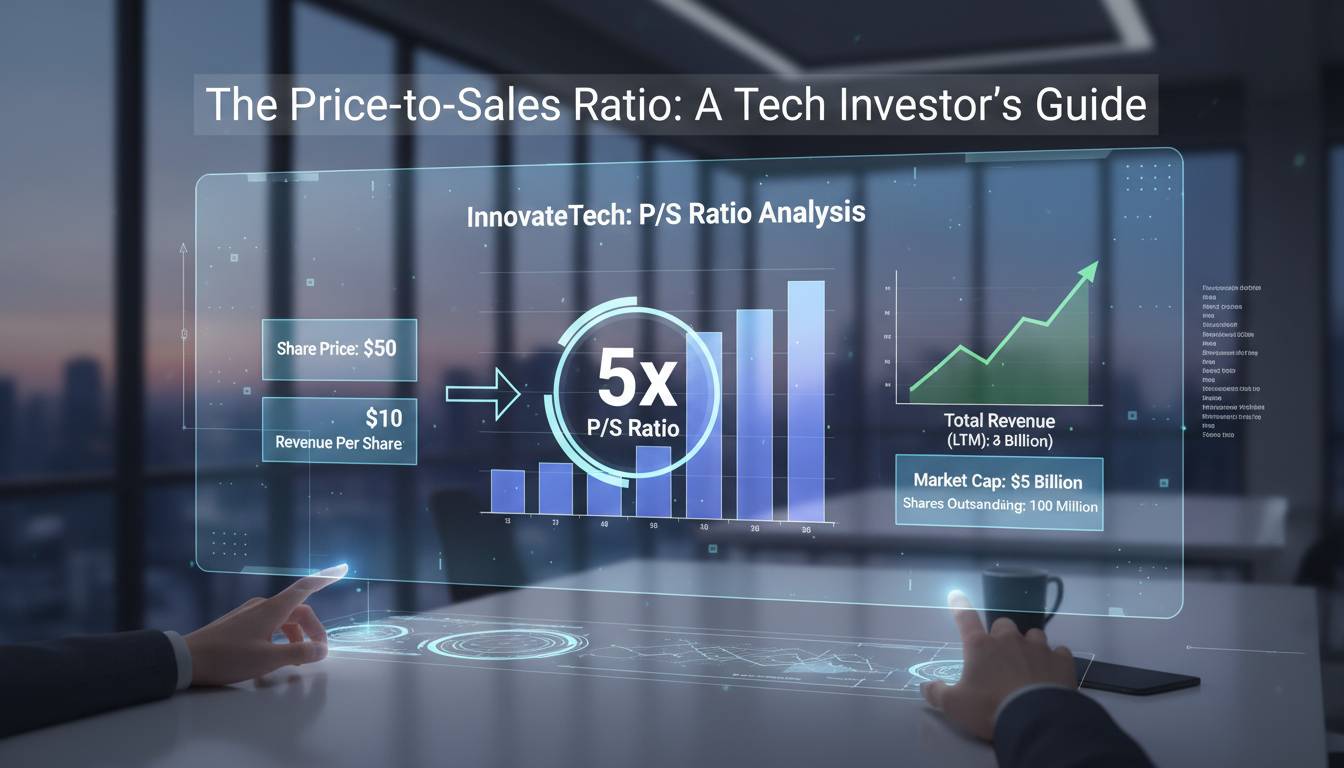
P/S Ratio = Market Capitalization ÷ Total Revenue
You can also calculate it on a per-share basis:
P/S Ratio = Share Price ÷ Revenue Per Share
Market capitalization equals the stock price multiplied by the total number of outstanding shares. Revenue refers to the company’s trailing twelve-month (TTM) revenue, though some analysts use forward revenue estimates for growth companies.
Here’s something most articles won’t tell you: the P/S ratio has significant blind spots. It tells you nothing about profitability, debt levels, or cash flow. A company could be burning cash at an alarming rate and still look “cheap” by P/S metrics. That’s why understanding when to use this ratio—and when to look elsewhere—is just as important as knowing how to calculate it.
How to Calculate the P/S Ratio
The calculation is straightforward, but the data inputs matter more than most investors realize. Let me walk through two real examples using recent market data.
Example 1: Microsoft (MSFT)
As of early 2025, Microsoft trades around $420 per share with approximately 7.43 billion shares outstanding. The company’s TTM revenue sits at approximately $245 billion.
Market Cap = $420 × 7.43 billion = $3.12 trillion
P/S Ratio = $3.12 trillion ÷ $245 billion = 12.7x
Example 2: Snowflake (SNOW)
Snowflake trades around $180 per share with approximately 330 million shares outstanding. The company’s TTM revenue is roughly $3.4 billion.
Market Cap = $180 × 330 million = $59.4 billion
P/S Ratio = $59.4 billion ÷ $3.4 billion = 17.5x
Notice something interesting: Snowflake trades at a higher P/S than Microsoft despite being far smaller and less established. That’s not necessarily a sign Snowflake is overvalued—it reflects investor expectations for continued rapid revenue growth. This is exactly where P/S becomes useful for growth tech stocks.
Revenue figures vary depending on whether you use GAAP revenue, non-GAAP revenue, or forward estimates. Always verify which revenue number the calculation uses. Some analysts prefer enterprise value to market cap, which factors in debt and cash—more on that distinction later.
Understanding P/S Ratio Values
Here’s the uncomfortable truth: there’s no universal “good” P/S ratio that applies across all sectors. A P/S of 3 might be wildly expensive for a utility company and ridiculously cheap for a high-growth software company.
General Benchmarks
- P/S below 1: Often considered value territory, though it can signal serious problems
- P/S between 1 and 3: Typical for mature industries with modest growth
- P/S between 3 and 10: Common for established growth companies
- P/S above 10: Premium valuation reserved for fast-growing companies with strong market positions
Tech Sector Context
The S&P 500 technology sector currently trades at a P/S around 7-9x, well above the broader market average of roughly 2.5x. This premium reflects the scalability of software business models—once you’ve built the product, incremental revenue flows to the bottom line with minimal marginal cost.
For comparison, the consumer staples sector trades around 1.5x revenue. These companies sell soap and groceries; their revenue growth is inherently limited by population growth and inflation. Tech companies can grow revenue 20%+ annually for years if they’ve found product-market fit.
When evaluating P/S for tech companies, context everything. A 15x P/S might be expensive for a slow-growth legacy software company but cheap for a company growing revenue 50% annually.
When to Use the Price-to-Sales Ratio
The P/S ratio becomes particularly valuable in specific situations where other metrics fail.
Use Case #1: Pre-Profit or Loss-Making Companies
This is where P/S shines brightest. When a company hasn’t generated net income—or has only recently become profitable—P/E becomes meaningless or wildly volatile. Consider Rivian (RIVN), the electric vehicle manufacturer. The company lost approximately $5.5 billion in 2023, making a P/E ratio impossible to interpret meaningfully. But Rivian generated $4.4 billion in revenue that year, giving investors a P/S of roughly 2.5x—a figure they could actually compare to peers.
Use Case #2: Comparing Companies with Different Capital Structures
Earnings can be distorted by one-time charges, stock-based compensation, and varying accounting treatments. Revenue is harder to manipulate and provides a cleaner comparison. When comparing Salesforce to ServiceNow, both enterprise software companies, P/S gives you a more apples-to-apples comparison than P/E, which can be heavily influenced by each company’s investment in growth and acquisition-related expenses.
Use Case #3: Identifying Early-Stage Winners
Revenue growth often precedes profitability in tech. A company growing revenue at 60% annually while losing money is executing a deliberate strategy—investing in expansion ahead of harvesting margins. P/S lets you value this growth before profits materialize. Amazon spent years as a loss-making company by traditional metrics while building an infrastructure empire; P/S captured its trajectory when P/E couldn’t.
The Honest Limitation
P/S says nothing about a company’s path to profitability. You could find a company trading at 2x revenue that burns so much cash it never survives to see profitable days. Always pair P/S with cash flow analysis and runway calculations for loss-making companies.
P/S Ratio Limitations
I want to be crystal clear about what P/S doesn’t tell you, because ignoring these limitations turns a useful metric into a dangerous one.
It Ignores Profitability
Revenue is vanity; profit is sanity. A company generating $1 billion in revenue while losing $500 million is growing its top line but destroying shareholder value. The P/S of 5x looks reasonable until you realize the business model may never generate returns. Tesla trades at approximately 9x revenue as of early 2025, while Ford trades around 0.4x—does that make Ford the better value? Only if you ignore that Tesla’s revenue growth dwarfs Ford’s and its software business has fundamentally different economics.
It Doesn’t Account for Debt
A company with $10 billion in revenue and $8 billion in debt looks very different than one with $10 billion in revenue and zero debt. EV/Revenue (enterprise value divided by revenue) corrects for this by factoring in net debt. For heavily leveraged tech companies, EV/Revenue provides a more accurate picture than simple P/S.
It Treats All Revenue Equally
$1 million in SaaS recurring revenue is worth more than $1 million in one-time consulting revenue. The predictability and growth trajectory of revenue matters. Two companies could have identical P/S ratios but wildly different business quality. Always examine revenue composition—what percentage is recurring versus transactional?
It Misses Capital Intensity
A software company with 80% gross margins and minimal capital requirements isn’t comparable to a semiconductor manufacturer requiring billions in fab investments. The same P/S could represent a bargain in one case and a trap in another. This is particularly relevant when comparing software companies to hardware or infrastructure tech businesses.
P/S Ratio for Tech and SaaS Companies
The price-to-sales ratio deserves a special place in every tech investor’s framework. Here’s why.
Why P/S Works Better for Tech
Tech companies, particularly SaaS businesses, often prioritize growth over profitability. They’re investing heavily in product development, sales teams, and infrastructure to capture market share before competitors do. This strategy can produce years of losses while building enormous enterprise value—think of AWS in its early years or many of today’s AI infrastructure companies.
Traditional P/E ratios fail in this environment because earnings don’t reflect the underlying business health. A rapidly growing SaaS company might report losses today but have 90%+ gross margins and 120%+ net revenue retention—metrics that suggest profitability is a matter of when, not if. Revenue-based valuation captures this optionality better than earnings-based metrics.
Tech Sector Benchmarks
As of early 2025, here’s how major tech sub-sectors typically stack up:
- Consumer Internet: 3-6x revenue (Google, Meta)
- Enterprise SaaS: 6-15x revenue (Salesforce, ServiceNow)
- Semiconductors: 5-12x revenue (NVIDIA, AMD)
- Cloud Infrastructure: 6-18x revenue (AWS, Azure, Google Cloud)
These ranges shift significantly with market conditions. During the 2020-2021 growth stock boom, SaaS companies routinely traded above 20x revenue. The 2022 correction brought many back to single digits. The key isn’t fixating on any single number but understanding what the current P/S implies about growth expectations.
A Counterintuitive Point Most Articles Skip
Here’s something conventional wisdom gets wrong: a declining P/S can actually signal problems, not opportunities. If a company’s revenue is shrinking but the stock price is falling faster, the P/S compresses—making it look cheaper even as the business deteriorates. Always verify that revenue is growing before celebrating a low P/S.
When P/S Alone Isn’t Enough for Tech
For mature tech companies like Apple or Microsoft, P/S tells you less than P/E or free cash flow yield. These companies generate substantial profits, and focusing only on revenue misses the efficiency of their operations. Apple’s 12x P/S is less informative than its 30%+ operating margin and $100 billion annual free cash flow. Use P/S for growth and early-stage companies; shift to profit-based metrics as companies mature.
Conclusion
The price-to-sales ratio isn’t a magic bullet that solves all valuation challenges. It won’t tell you which tech stock will outperform, and relying on it exclusively for mature companies misses critical information about profitability and capital efficiency. But for a specific slice of the market—growth-stage tech companies, pre-profit SaaS businesses, and companies where earnings are distorted by investments in future growth—P/S provides insight that P/E simply cannot.
What separates skilled tech investors from amateurs is knowing which metric matters for which situation. The next time you encounter a high-growth company reporting losses, don’t reach for P/E. Calculate the P/S instead. You might find a company trading at 4x revenue that everyone else has abandoned—one that’s actually executing on a viable path to becoming the next dominant player in its market.
The best investors I know use P/S as one input among many, always cross-referenced with cash flow, competitive positioning, and growth trajectory. Treat it as a lens, not a verdict, and you’ll avoid the trap of valuing everything by a single number.
