If you’re evaluating tech stocks using only net income, you’re missing a big part of the picture. Free cash flow strips away accounting illusions and shows you what a company actually generates in cash. For tech companies, this matters more than most investors realize.
The software industry has gotten good at deferring expenses and recognizing revenue on timelines that favor their reported earnings. Net income often has little resemblance to the money actually flowing through the business. Free cash flow corrects for this. It tells you whether a tech company can fund its growth, return capital to shareholders, and survive a downturn without tapping the debt markets.
This guide walks through how to calculate, analyze, and interpret free cash flow when looking at technology companies. I’ll show you the framework I use, walk through examples from recognizable companies, and be upfront about where this metric has genuine limitations.
What is Free Cash Flow?
Free cash flow represents the cash remaining after a company has paid for all its capital expenditures — the money spent maintaining and growing the physical asset base. It’s what the business could theoretically distribute to shareholders through dividends, buybacks, or debt repayment while still maintaining its current operational capacity.
The formula is straightforward:
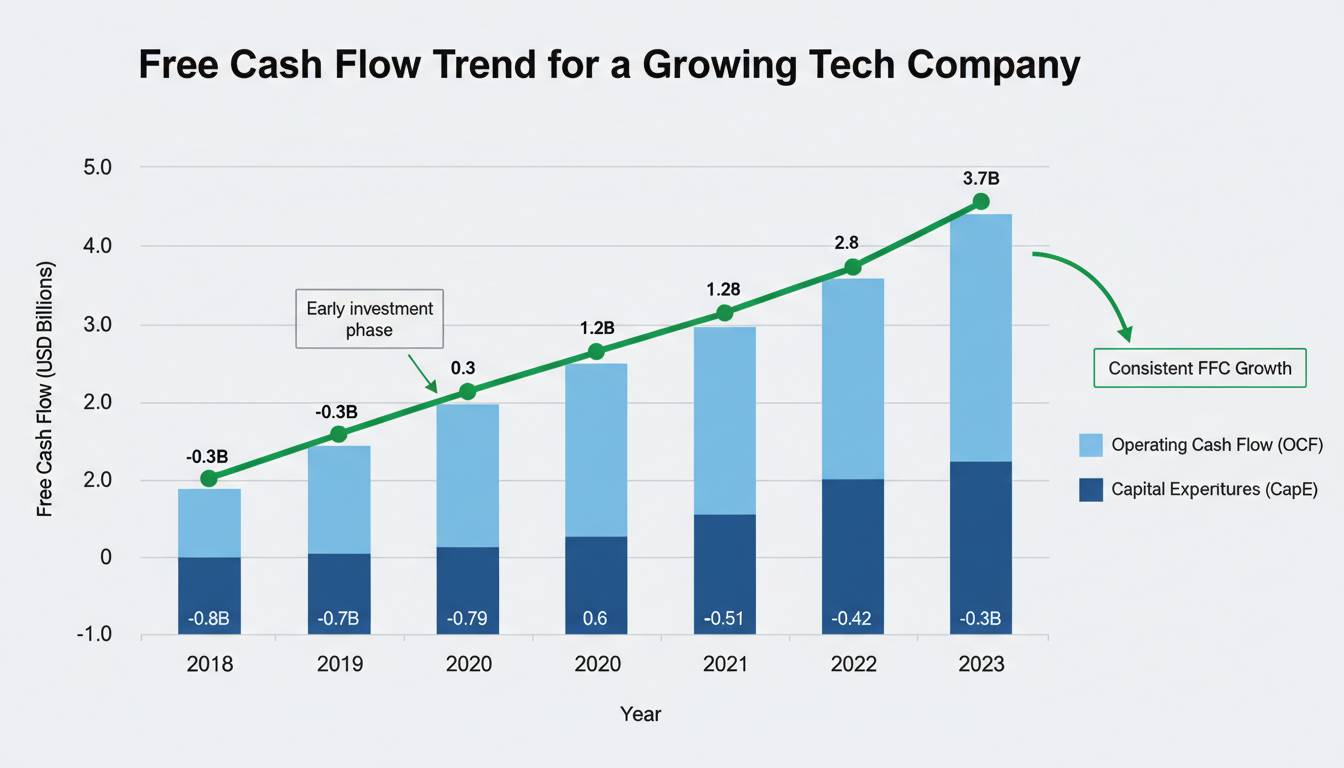
Free Cash Flow = Operating Cash Flow − Capital Expenditures
Operating cash flow comes from the cash flow statement and reflects the cash generated from core business operations before financing and investing activities. Capital expenditures (CapEx) are the cash outlays for property, equipment, and other long-term assets. For tech companies, you’ll often see CapEx grouped with “purchases of property and equipment” in the cash flow statement.
The key insight here is that free cash flow is harder to manipulate than earnings. Net income relies on assumptions about depreciation methods, revenue recognition timing, and stock-based compensation. Cash flow is closer to what actually moved through the company’s bank accounts. This makes it particularly valuable for evaluating businesses where the gap between reported earnings and actual cash generation tends to be substantial.
Why Free Cash Flow Matters More for Tech Companies
Tech companies play by different financial rules than manufacturers or retailers, and those differences make free cash flow especially revealing.
Consider how software companies recognize revenue. Under ASC 606, revenue from multi-year software contracts gets recognized ratably over the contract period, even if the customer pays upfront. A SaaS company might collect a $120,000 multi-year payment in year one, but only recognize $40,000 as revenue that year. Net income would look relatively flat, but operating cash flow would show a massive inflow. This mismatch between earnings and cash is intentional and appropriate — but it means looking at net income alone will mislead you about the business’s actual strength.
Stock-based compensation further distorts earnings. Tech companies routinely issue stock options and restricted stock units to employees. These show up as non-cash expenses on the income statement, reducing reported net income without affecting cash flow at all. When a company like Meta or Google lists $15 billion in stock-based compensation, that’s a real cost to shareholders through dilution, but it doesn’t show up in free cash flow the way it drags down earnings.
Capital intensity also varies dramatically across the tech sector. A hyperscale cloud provider like Amazon Web Services requires massive data center investments — billions annually — which shows up as CapEx and directly reduces free cash flow. Meanwhile, a software company with a cloud-native architecture might run its entire service on rented infrastructure, keeping CapEx minimal and free cash flow high. Comparing these two businesses on net income alone would be comparing apples to spacecraft.
This is why professional investors in tech often treat free cash flow as the primary metric for valuation. The price-to-free-cash-flow ratio gives you a clearer picture of what you’re paying for actual cash-generating ability rather than accounting profit.
How to Calculate Free Cash Flow for Tech Companies
Pulling the numbers is simpler than most people expect. Every publicly traded company publishes a cash flow statement in its quarterly and annual reports, and all three required inputs are right there.
Start with operating cash flow. This line — sometimes called “cash provided by operating activities” — captures the cash generated from the core business after accounting for working capital changes. For Apple in their fiscal 2024, operating cash flow was approximately $118 billion. You’ll find this in the quarterly 10-Q and annual 10-K filings, easily accessible through the SEC’s EDGAR database or any financial data platform.
Next, locate capital expenditures. In the cash flow statement, look for “payments for property, plant and equipment” or simply “capital expenditures.” This represents the cash actually spent on physical assets during the period. Apple’s CapEx for fiscal 2024 was roughly $9.5 billion.
Subtract CapEx from operating cash flow, and you have free cash flow. For Apple: $118 billion minus $9.5 billion equals approximately $108.5 billion in free cash flow.
A few practical notes for tech companies. First, watch for “operating lease right-of-use assets” — these show up on the balance sheet and cash flow statement under new lease accounting standards. Some analysts add back depreciation and adjust for changes in working capital to get a “normalized” free cash flow, but for most purposes, the direct calculation works fine. Second, be consistent. If you’re comparing two companies, use the same time period and same calculation method for both. Third, remember that free cash flow can be negative — many high-growth tech companies burn cash to expand. That’s not automatically a red flag, but it means you need to understand why.
How to Analyze Free Cash Flow in Tech Stocks
The raw number only tells you so much. What matters is what the free cash flow tells you about the business when you put it in context.
FCF as a percentage of revenue (FCF margin) is your first benchmark. Software companies with high gross margins often generate 30% to 40% free cash flow margins once they reach scale. Salesforce reported approximately 35% free cash flow margin in recent quarters — exceptional for a company of its size. Compare this to a hardware-centric company like Dell, where margins in the high single digits are realistic. If you’re looking at a tech company and the free cash flow margin is meaningfully below its peer group, dig into why. It might indicate competitive pressure, excessive spending, or an inefficient business model.
Growth rate matters enormously. A company generating $500 million in free cash flow and growing at 25% annually is far more valuable than one generating $1 billion but shrinking at 5%. Calculate the year-over-year change in free cash flow, but normalize for one-time items. If a company sold a division and got a cash infusion, that inflates the number and makes growth look artificial. Look at trailing twelve-month figures to smooth out quarterly volatility.
Free cash flow conversion compares free cash flow to net income. A ratio above 100% means the company converts more earnings to cash than it reports as profit — common in capital-light software businesses. Below 100% suggests the company is spending heavily, either on growth or on items that won’t pan out. For most mature tech companies, you want to see conversion in the 90% to 120% range.
Shareholder yield is perhaps the most underappreciated frame. Take the free cash flow per share, divide by the stock price, and you get a yield. Then compare this to the dividend yield. Companies like Microsoft and Apple generate so much free cash flow that they return vast amounts through buybacks and dividends. If a tech company’s shareholder yield exceeds its dividend yield by a wide margin, that’s often a sign of an exceptionally cash-generative business — or a stock that’s undervalued.
Real Examples: FCF Analysis of Top Tech Companies
Putting theory into practice helps clarify how these metrics play out in the real world.
Apple generated roughly $108.5 billion in free cash flow during fiscal 2024. That’s a 37% free cash flow margin on revenue of approximately $385 billion. The company returned over $100 billion to shareholders through dividends and buybacks while still sitting on a massive cash pile. Apple’s story is one of a mature company with exceptional cash generation — the question for investors is whether the growth engine can still accelerate given how large the business has become.
Microsoft produced approximately $87 billion in free cash flow for fiscal 2024 with margins hovering around 40%. Azure growth drives the narrative, but the underlying reality is that Microsoft’s software and cloud businesses generate cash with remarkable efficiency. The company has consistently converted over 100% of net income to free cash flow, partly because stock-based compensation is so large relative to reported earnings. If you’re evaluating Microsoft, the free cash flow figure gives you more confidence in the business’s durability than net income alone.
Amazon tells a different story. While the company generates massive operating cash flow — approaching $70 billion annually — heavy investment in fulfillment centers, AWS infrastructure, and other CapEx-intensive operations means free cash flow remains significantly lower. The investment is intentional: Amazon prioritizes growth over cash conservation. For value investors, this makes Amazon harder to evaluate on free cash flow alone. You’re betting that the reinvestment will pay off in future returns rather than that you’re buying a cash machine today.
Comparing these three reveals the danger of using free cash flow in isolation. Apple and Microsoft look like cash cows — and they are. But Amazon’s lower free cash flow reflects a fundamentally different strategy. Neither is wrong; they’re just different bets. Your analysis needs to account for what the company is trying to do, not just what the cash flow statement says.
Common Mistakes When Using Free Cash Flow
Free cash flow is powerful, but it has blind spots that trip up inexperienced investors.
Ignoring growth investment is the most common error. A company deliberately running negative free cash flow to capture a massive market opportunity isn’t broken — it’s executing a strategy. The issue arises when you can’t tell the difference between productive investment and wasteful spending. If Amazon’s CapEx is generating 25% returns and the market is expanding, burning cash makes sense. If a smaller company is burning cash with no clear path to profitability, that’s a different problem. Context matters enormously here.
Focusing on a single quarter creates misleading conclusions. Tech revenue tends to be lumpy — enterprise software deals close sporadically, hardware launches create seasonal spikes, and economic cycles affect IT spending. Look at trailing twelve-month free cash flow, or better yet, analyze a multi-year trend. One bad quarter doesn’t mean the business model is broken, just as one exceptional quarter doesn’t make the stock a bargain.
Treating all CapEx as equal creates analytical errors. A company investing heavily in data centers for cloud growth is fundamentally different from one replacing aging manufacturing equipment. Both show as CapEx, but the return profiles differ dramatically. Dig into the MD&A section of the 10-K to understand what the CapEx is actually funding.
Limitations of Free Cash Flow Analysis
Even applied correctly, free cash flow has genuine limitations that honest analysts acknowledge.
For high-growth companies, free cash flow will often be negative or modest. This doesn’t automatically mean the stock is overvalued — it means you’re making a growth bet rather than a cash bet. Companies like Snowflake or Datadog trade at valuations where free cash flow is barely relevant because investors are pricing in future dominance, not current cash generation. If you refuse to consider any company with negative free cash flow, you’ll miss some legitimate winners. The discipline comes from understanding when negative free cash flow reflects a temporary growth phase versus a structural inability to ever generate cash.
Acquisition-heavy companies present another challenge. When a tech giant acquires another company, the cash spent shows up immediately in the cash flow statement as an investing activity — but the returns from that acquisition may take years to materialize. This creates volatility in free cash flow that doesn’t reflect the underlying operating business. You need to adjust your analysis to understand what “normalized” free cash flow looks like by adding back large acquisitions or analyzing pre-acquisition results.
Finally, free cash flow says nothing about capital allocation. A company can generate enormous free cash flow and still destroy value if leadership spends it poorly — on overpaid acquisitions, vanity projects, or ego-driven expansion. Free cash flow tells you how much cash there is to allocate. It doesn’t tell you whether the allocation will create value. That’s a judgment call that requires understanding management’s track record and incentives.
Frequently Asked Questions
What is a good free cash flow margin for a tech company?
For software and SaaS companies at scale, 25% to 40% is a healthy range. Companies like Microsoft and Adobe consistently generate margins in the high thirties. Hardware-heavy tech companies typically see lower margins — 10% to 20% is solid. Anything below 10% in software suggests competitive pressure or excessive spending.
Why is free cash flow more reliable than net income for tech stocks?
Tech companies have significant non-cash expenses like stock-based compensation, aggressive revenue recognition practices, and substantial deferred costs. Free cash flow sidesteps many of these accounting choices by looking at actual cash movement rather than accrual-based earnings.
Can free cash flow be negative and still indicate a healthy tech company?
Yes, particularly for high-growth companies in expansion mode. The key is understanding why it’s negative. If the company is investing in high-return opportunities that will compound, negative free cash flow is acceptable. If it’s burning cash to sustain revenue that isn’t growing, that’s a warning sign.
How does free cash flow differ from operating cash flow?
Operating cash flow includes all cash from operations before capital expenditures. Free cash flow subtracts CapEx to show what’s actually available for distribution or reinvestment. The difference is meaningful for capital-intensive businesses.
Moving Forward
Free cash flow is your most reliable window into what a tech company actually produces in value — not what accountants say it earned, but what it can physically deploy. For the software and cloud companies dominating the sector, this metric cuts through the noise better than earnings, revenue, or almost any other financial measure.
That said, free cash flow is a tool, not a rule. It tells you about the cash engine. It doesn’t tell you whether that engine is pointed in the right direction. You’ll still need to evaluate competitive positioning, management execution, and market opportunity — the qualitative factors that separate the winners from the cash-burners.
If you’re serious about tech investing, build free cash flow into your regular analysis. Track it over time, compare it against peers, and always ask why the number looks the way it does. The investors who treat financial metrics as a starting point for deeper inquiry tend to do better than those who treat them as a final answer.
